On a river-monitoring page, a water-level graph and a flow graph can look like two versions of the same story. Both rise after rain. Both fall as the catchment drains. Their units reveal that they describe different things: height at a place, and volume passing through it over time.
At many gauging stations, the flow record begins with the height record. The instrument observes a relatively accessible quantity, and a relationship established through field measurements converts it into discharge. That relationship has to remain faithful to a river whose bed, banks and vegetation can change.
The smooth line on the screen depends on repeated visits to the water.
Start with the level
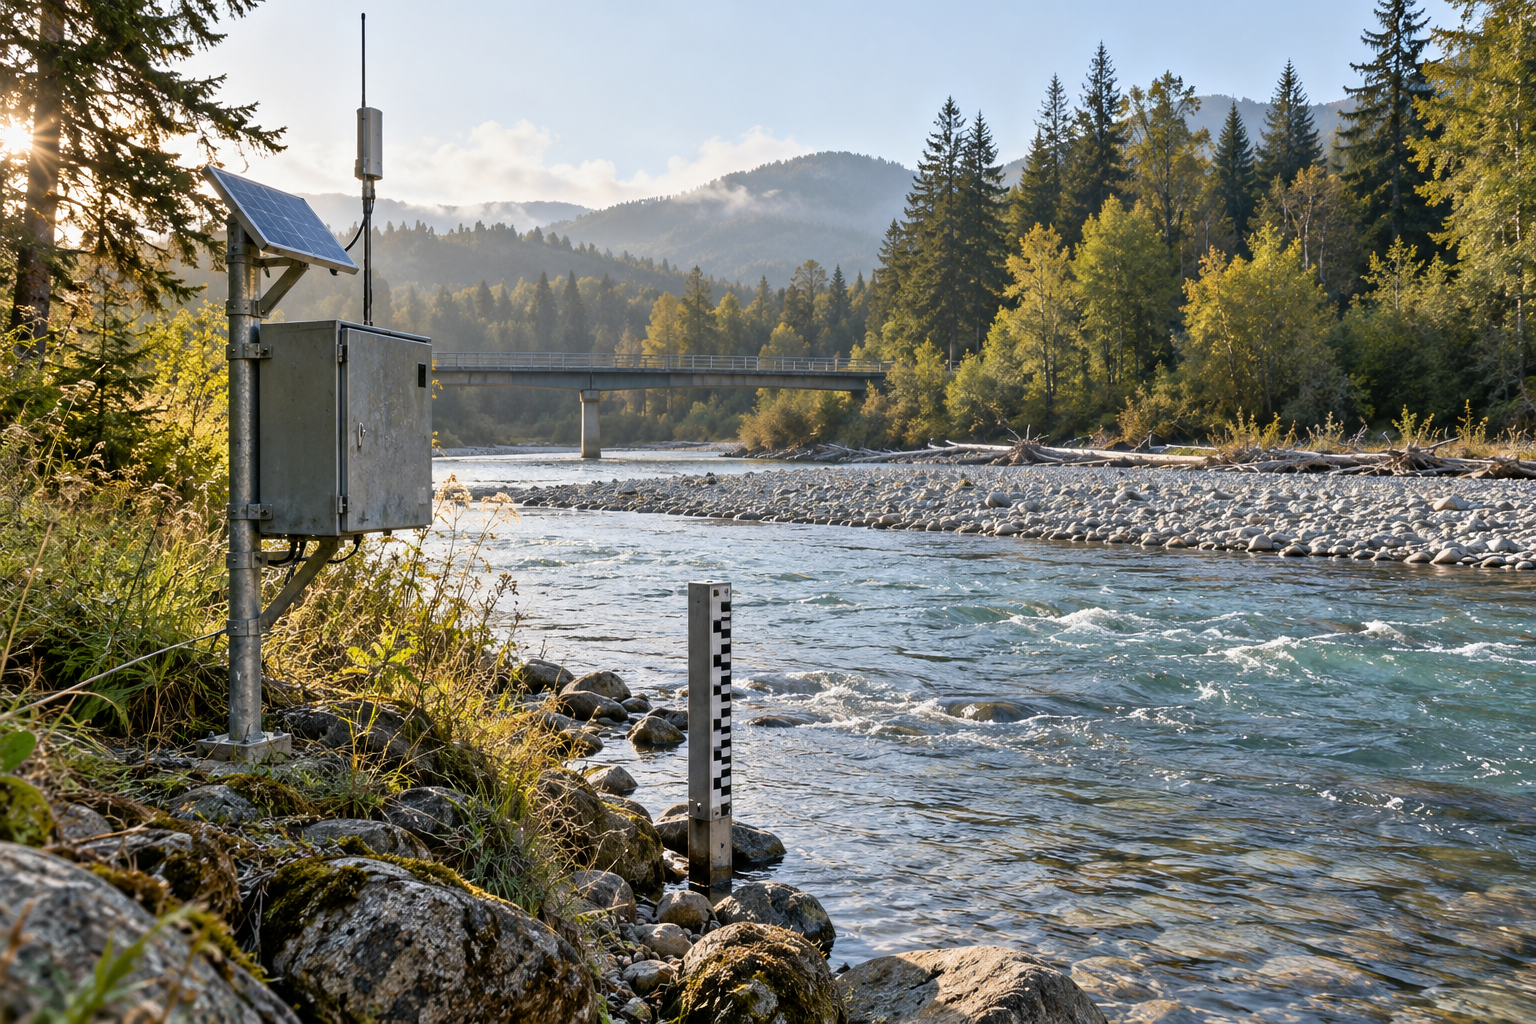
Hydrologists call the water-surface height stage. It is measured against a reference elevation, so a reading of two metres does not automatically mean the river is two metres deep. Finding depth also requires the position of the bed. The USGS account of its data-collection process makes that distinction before explaining how stage becomes a flow record.
The same account describes a stilling well: a chamber connected to the river, where the water level follows the river while short-lived surface disturbances are damped. Other arrangements use pressure. In a bubbler system, the pressure needed to push gas through an underwater opening changes with the height of water above it.
Those are ways of observing level. Neither operation counts all the water passing the station. The missing quantity requires a different kind of measurement, spread across the channel rather than confined to one reading beside it.
Take the cross-section seriously
Discharge is a volume per unit time, commonly expressed in cubic metres per second or cubic feet per second. A useful starting relationship is cross-sectional area multiplied by average velocity. The word average does considerable work: the speed at one convenient spot is not necessarily representative of the whole section.
The USGS streamgage fact sheet describes measuring depths and velocities at multiple positions across a river. These observations supply the information needed to estimate the water passing through the section. Repeating the exercise at different water levels produces paired observations of stage and discharge.
Those pairs establish a rating curve. Once the relationship is sufficiently defined, a continuing series of stage readings can be translated into discharge estimates between field visits.
Think of the curve as a compact account of how this particular reach conveys water. Channel shape, roughness and the conditions controlling flow are built into it. Its value comes from the connection to the place; another river's attractive, well-measured curve cannot simply be borrowed.
The river can change the relationship
Imagine returning to a station after a flood has rearranged part of the bed. The same reading on the gauge now accompanies a different channel. Applying the old relation without checking it would assume away the very change the flood has made.
That is one reason a rating needs continuing measurements. A second is that a changing flood can complicate the relation even without a permanent alteration to the channel. Stage alone may not capture everything needed to describe the flow.
Robert Holmes's study of river-rating complexity examined 39 discharge measurements collected during 56 days of flooding on the Mississippi at St. Louis in 2015. Measurements made while the river rose and fell did not all follow one simple relation. The adjusted rating used in the study came within eight per cent of every measured discharge in that campaign.
That percentage describes the comparison in the study, not the accuracy of every river gauge. The more general lesson is in the loop: the same stage can accompany different flows on different parts of a flood. A height reading gives a position on the gauge, while the river's changing hydraulic conditions help determine what that position means.
Ice exposes two different problems
Ice can interfere with the instrument. It can also interfere with the relationship the instrument's reading is fed into. Keeping those possibilities separate prevents a good observation from being mistaken for a complete flow measurement.
The USGS New Jersey Water Science Center's explanation describes both. Frozen equipment or ice beneath a radar sensor can corrupt a level reading. But ice building on a feature that controls flow can genuinely raise the water surface. In that case, the recorded stage may be correct while the discharge inferred from the ordinary rating is unreliable.
It is an instructive distinction because the usual response to an implausible number is to suspect the sensor. Sometimes the sensor is accurately reporting a situation the conversion model no longer describes. Replacing one with a more precise instrument would leave that problem untouched.
The question becomes: which part of the measurement chain needs attention?
Add another observation when height is insufficient
Where a single stage can correspond to more than one discharge, an index-velocity method can provide additional information. It uses a measured velocity as an indicator of the mean velocity across a surveyed section, while a separate relation links stage to the section's area. Multiplying the resulting area and mean velocity gives discharge.
Levesque and Oberg's USGS methods report sets out how those relationships are developed and checked. The extra instrument does not eliminate calibration. The observed velocity still has to be related to the water moving through the whole section, and the section itself needs to be surveyed.
This is a more useful response to a complicated river than demanding that every station use the same simple recipe. The observations and calculations have to suit the conditions at the site.
Read the status beside the number
A recent value can be useful before its review is finished. That is why the distinction between provisional and approved data matters. The USGS Georgia Water Science Center's quality-assurance plan documents the review of stage records, discharge measurements and rating information, and explains why preliminary online data may later be revised.
A revision can reflect better knowledge of the instrument or the river. For a reader comparing records, it is worth keeping the station, time, units and data status together rather than copying the largest number out of a graph. The plotted estimate has a history, and some of that history is still being checked.
If you download the series again later and find a different peak estimate, the record's status and revision history deserve a look before you compare the numbers. The water passed the station once. The account of its passage can improve afterward.
A thought worth keeping?