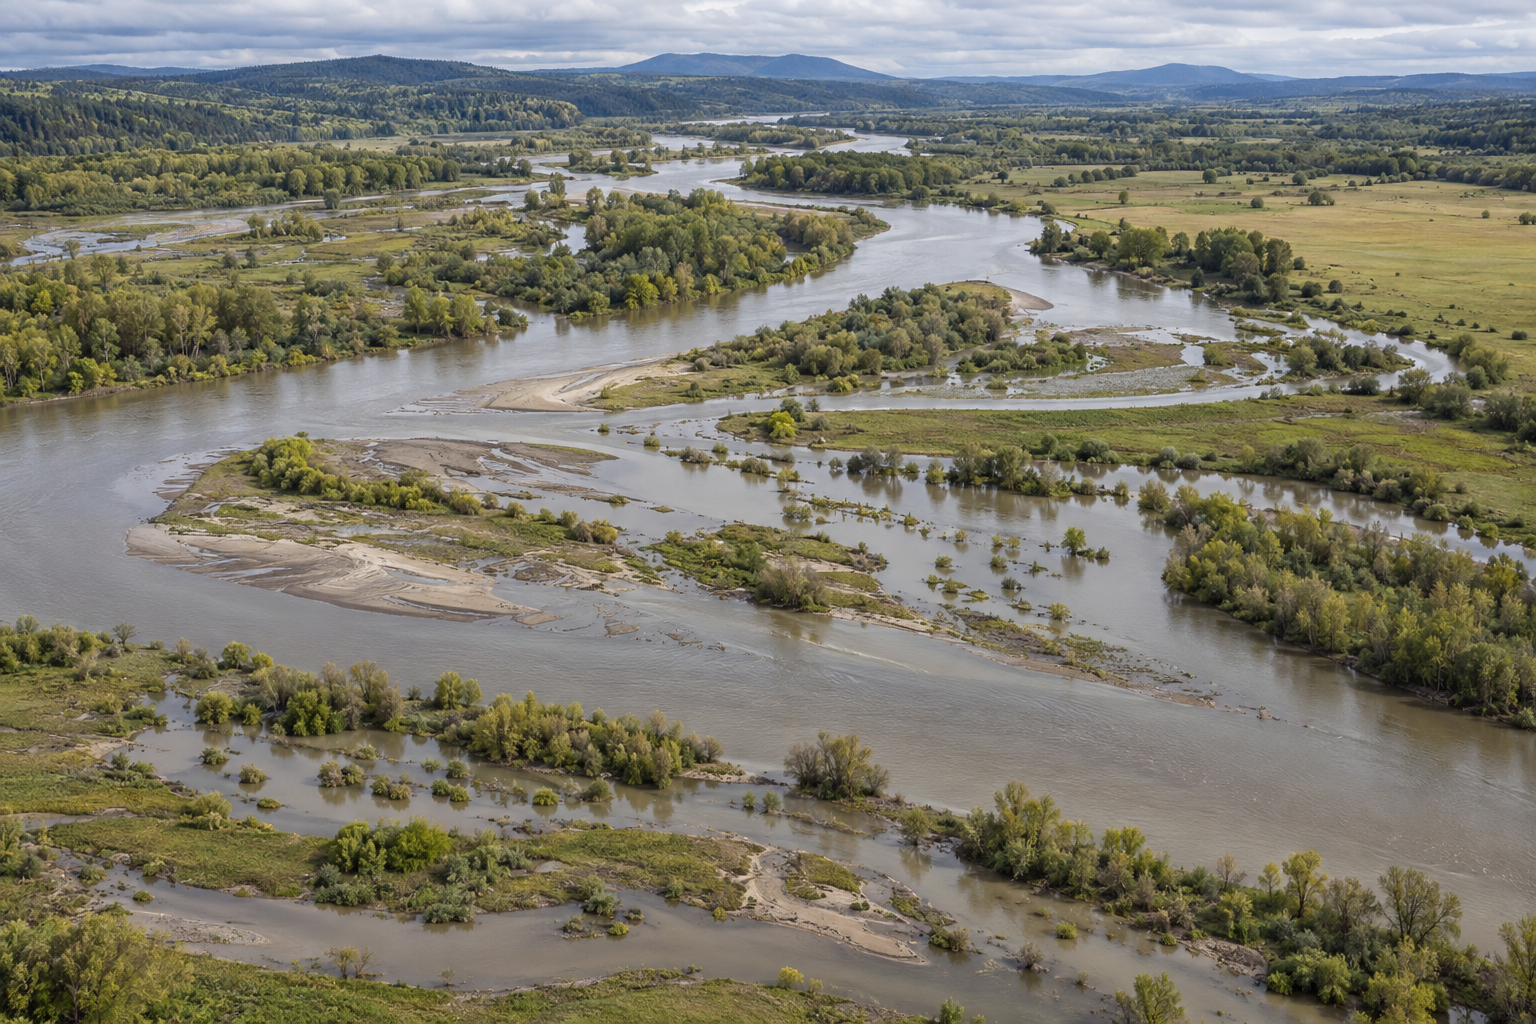
On a flood map, water stops at a line. Beside a river, its edge is harder to find. A shallow sheet may run into an old channel, leave silt across a field and retreat before the main flow falls. The next flood may fill a different hollow. A map must choose a boundary to answer a question; the river occupies a range of levels and uses its valley in more than one way.
That does not make the boundary useless. In the United States, a widely used floodplain line marks the estimated reach of a flood with a 1% chance of being equalled or exceeded in any given year. It supports planning and regulation. The old phrase “100-year flood” can make it sound like a date on a calendar, though the probability applies each year. To understand the place the line crosses, we need to ask what water level it represents, how deep water might be, what other kinds of flooding can arrive, and how the channel and land may change.
One level among many
A floodplain map usually begins with an estimated flow, a model of how that flow moves through a channel and over its banks, and a description of the land's elevation. The resulting boundary is the intersection of a particular simulated water surface with that terrain. Move the water surface up or down, and the boundary moves. A single line hides that simple fact.
The U.S. Geological Survey's Blue River map library makes it visible. For a 4.6-mile reach near Red Bridge Road in Kansas City, researchers computed 37 water-surface profiles at one-foot intervals, from a stage near bankfull to one above the estimated 0.2%-annual-chance flood stage. They combined a hydraulic model with detailed terrain data to estimate both inundated area and depth at each stage. These are modelled maps for that reach, tied to a particular streamgage; they are not 37 observed flood outlines or a promise that any future flood will follow a contour exactly.
The series answers a question a single outer line cannot: which lower ground goes under first, and how much deeper the water becomes as stage rises. Depth matters to a road, a crop and a building in different ways. So does access. A dry patch surrounded by flooded approaches is not experienced as safely “outside” simply because its own elevation remains above the water. The boundary can identify a useful threshold while leaving the consequences inside it uneven.
The rain that produces a given stage also has a history. In a Muddy Creek study in Missouri, USGS researchers varied rainfall amount and duration, how wet the basin was beforehand, and channel conditions such as culvert cleaning and detention storage. Their model produced different streamflows and inundation maps from those combinations. A storm after saturated days can behave differently from one after dry weather. The precise maps belong to Muddy Creek, but the method shows why a flood boundary cannot be read without its assumptions about the water arriving and the channel carrying it.
More than one route to wet ground
Even a good river-stage map does not describe every way water can reach the same patch of land. Rain can collect where drainage fails before the nearby river overtops. Coastal water can push inland. Where these processes meet, their timing matters. A 2020 open-access U.S. flood-hazard modelling study put river, rainfall-driven and coastal flooding into one national framework and compared its results with local models and federal maps. The authors' model has its own grid, assumptions and uncertainties; it is not a more accurate parcel verdict everywhere. Its value here is to expose the missing question whenever one riverine outline is treated as a complete description of flood hazard: which water source made this line?
Frequency is another dimension flattened by one boundary. A 2019 study of 376 U.S. watersheds calculated expected annual flood damage across events of different probabilities and depths. In its model, the expected annual damage was generally several times the contribution from the 1%-annual-chance event alone; more frequent, smaller floods accounted for much of it. Those are estimates based on mapped watersheds, assets and damage assumptions, not a forecast for an individual home. They make a narrow point well: the event chosen to draw a regulatory boundary is not the only event that affects a floodplain.
Nor is the probability behind a map fixed forever. The same study explored how changing flood frequency and magnitude under warming could shift expected damage, while the broader U.S. model tested future conditions centred on 2035 and 2050. Their projections depend on emissions pathways and model choices. What matters for reading a line is the time stamp on its assumptions. A boundary drawn from one period's river behaviour and landscape is a useful estimate for that basis; it should not be mistaken for a permanent property of the soil.
The ground moves after the water
Water does not only cover a floodplain. It carries sand, fine sediment, seeds and wood into it, and can scour a new path back out. Those exchanges build the uneven ground that later floods encounter. A line showing inundation on a particular day cannot show the work of many wet days separated by years.
An experimental reconnection on California's Cosumnes River offers a concrete example. Researchers followed a floodplain after a 250-metre section of levee was removed. Comparing repeated terrain surveys, they found more than 25,000 cubic metres of sediment deposited in the original excavation area, along with sand splays, accumulating large wood and new native riparian plants. Some secondary flow paths formed as the site changed. This is one unregulated river with episodic floods and a deliberate intervention; its sediment volumes are not a figure to apply elsewhere. It shows what “connected to a floodplain” means physically: the river can move material as well as water sideways.
That connection also affects living communities, though its benefits are not automatic. In a 2024 study of six restored stream sites, researchers surveyed vegetation after legacy sediment removal and floodplain reconnection. Wetland-associated herbaceous plants became more prevalent. Where plant communities had been poor before the work, quality sometimes improved; at sites with better vegetation beforehand, quality did not necessarily improve and could fall. Removing a barrier or lowering ground can create conditions for one kind of habitat while losing another. An ecological floodplain needs more description than “flooded” or “not flooded”: how often, for how long, with what sediment and with which plants already there?
What to put beside the line
A good floodplain description can keep the boundary and add layers that answer different questions. The estimated depth at several water levels shows the gradient between a wet meadow and a deep road crossing. Gauge records and inundation maps place a present or forecast river stage in a local reach. Rainfall and antecedent soil conditions help explain how the water arrived. Old channels, levees, culverts and sediment deposits show where it might move or change the land. Repeated surveys can reveal whether yesterday's terrain is still a sound basis for tomorrow's model.
Each layer has a limit. The Blue River maps are tied to a model and gage; the Muddy Creek scenarios depend on selected rain and channel conditions; national projections cannot resolve every ditch and doorway. None of those limits makes measurement futile. They tell us which question each measurement can answer.
A boundary line is a decision drawn from a living system. It can say where one specified flood is estimated to reach. To understand a floodplain, keep that line, then look across it: at depth, time, routes, sediment and the ground the river is still making.
A thought worth keeping?